Geometrical constructions
Introduction
This section will teach you how to build mathematical constructions from geometrical elements. These constructions are dynamic, meaning students can drag points and see how this affects the whole construction.
Live example: Inscribed circle of a triangle. You can drag the vertices of the triangle.
Construction Canvas and Element Panel
Click on the Geometry and Graphs icon and then on the Geometry icon to get to the authoring panel. The rectangular area at the top left is the Construction Canvas, where you will build your construction. The Element Panel on the right shows all elements and their properties.

Adding elements to the canvas
You can build your construction using the tools from the toolbar. The two tools on the left allow you to select or remove elements. The other tools correspond to the mathematical elements you can add to the canvas.

Some buttons represent a group of tools. For example, the line button represents line, ray, segment, and vector tools. Click any one of these subtypes to activate it. Next, click on the canvas to create the elements.
Free, glider, and intersection points
Points are the most fundamental elements of any construction for two reasons:
- All other elements rely on points for their definition. For example, you define a line segment through its endpoints. A circle is defined by a midpoint and a point on the circle.
- Dragging points is what makes construction dynamic.
Points exist in three different types, depending on their freedom to move around:
- Free points are points that can move without restrictions. You create them by placing a point on an empty part of the canvas.
- Glider points can move along another element, such as a line, circle, or graph. If you place a point on a line, it will automatically snap to the line and become a glider point. A glider point cannot leave the element it is constrained to.
- Intersection points cannot be dragged and have their position completely defined by other elements. A point placed on the intersection of two lines is an example of a dependent point.
The example below illustrates Thales' theorem and uses all three point categories. Points and are free. Point is a glider point on the circle. Point is a dependent point constrained to the intersection of the line and the circle.
Live example: Points with different degrees of freedom.
Element dependencies
The live example above reveals that some elements depend on other elements. For instance, glider point lives on the circle, and the circle is defined through points and . If you drag point , all elements that depend on it will also move. If you delete point , the line, circle, glider point , and dependent point will also disappear.
It is important to be aware of dependency when you create your construction. Which points must students be able to move? These are the free points, and you should add these to the canvas first.
Changing properties in the element panel
The element panel shows a list of all elements you created. Click on an element to reveal its properties.

Depending on the element, you can configure all or some of the following types of properties:
- Style properties, such as color, line style, and line thickness.
- The element label. You can also hide the label.
- Element visibility. You can hide an element from the canvas. Invisible elements still exist, and visual elements can depend on invisible elements.
- A fixed point cannot be dragged.
- The element ID is not visible for students but allows you to refer to elements from other elements or evaluation criteria.
Making tools available to students
If you run an exercise, you will notice the toolbar is not present. Students have access to only the tools you made available.
Click on the Settings bar to expand it. Select the buttons you want to be included in the student toolbar.

Other element types
Besides basic elements like points, lines, and circles, you can use many other element types to build your constructions.
Polygon element

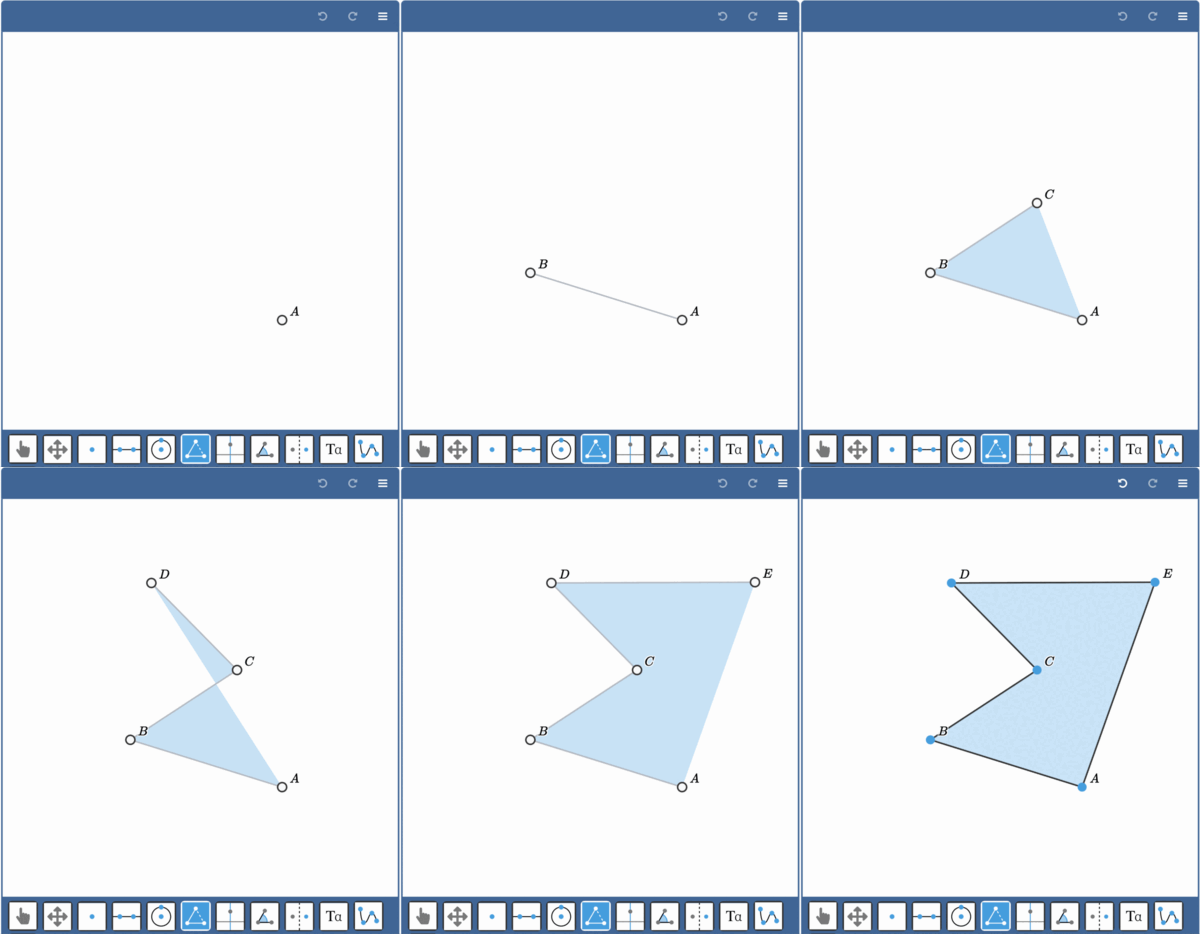
Figure: Creating a polygon.
A polygon is a figure made up of line segments. You create a polygon by creating a sequence of points in the canvas. Close the loop by clicking the first point again.
Disk element
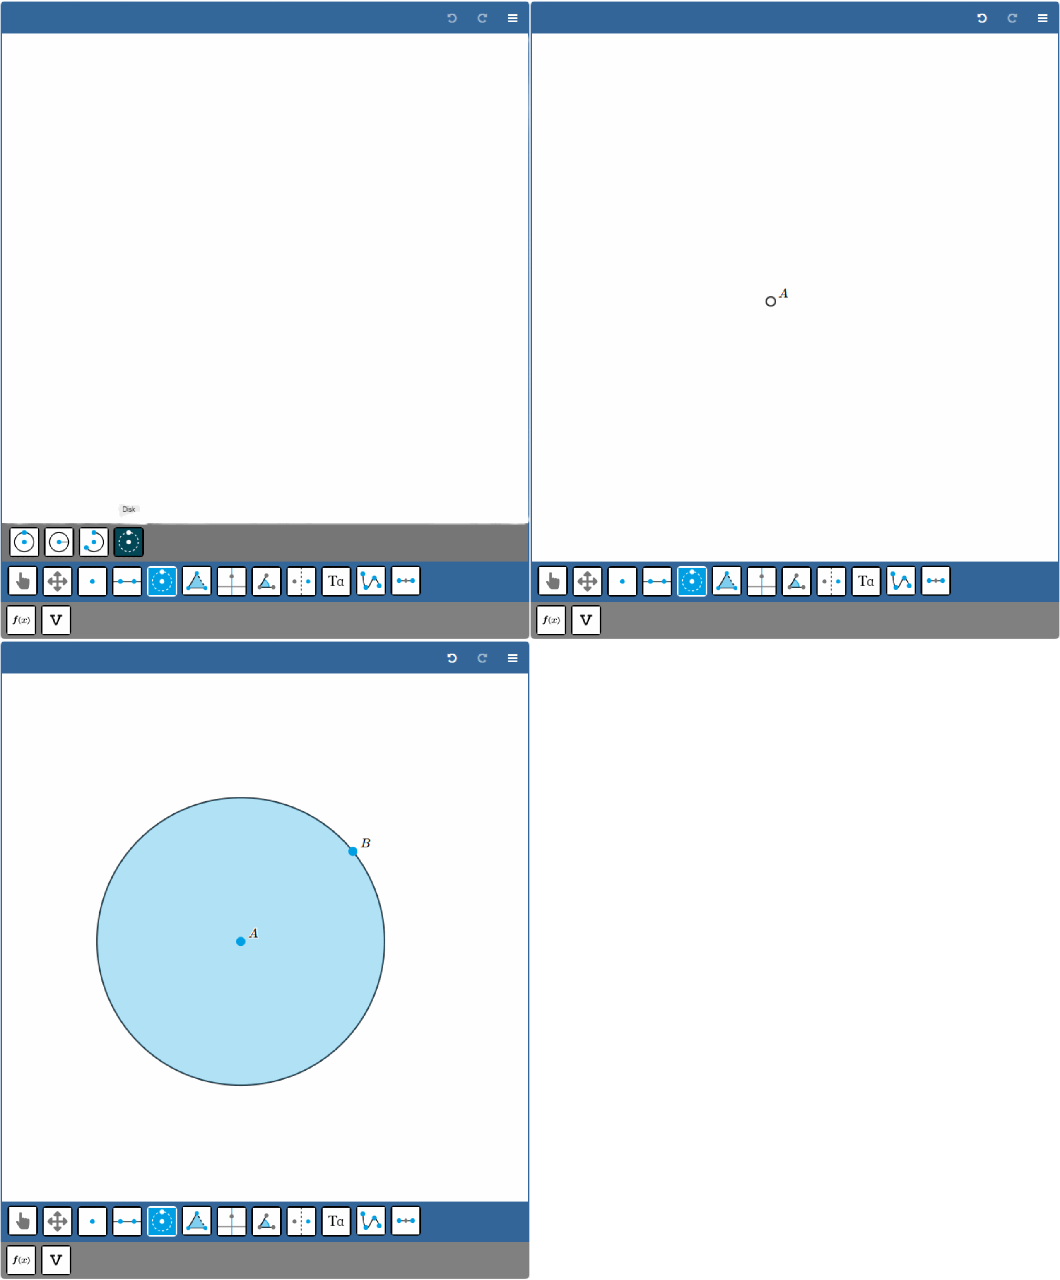
A Disk is the area inside a circle. The tool to create a disk works similar to the circle tool. Like the circle, you select the tool, then click where you want to place the center point, and then click somewhere else. This will draw a disk with the given center point, and the other point will be on the radius of the new disk.

Figure: Creating a disk.
When the disk is selected, it is possible to change its color and opacity in the Element Properties.
It is also possible to create a disk based on an existing circle. To do so, just click on the border of a circle (not a point on the border). This works for circles defined by two points as well as circles defined by a center point and radius.
Construction elements
Construction elements are special lines that can be constructed with a ruler and compass.
-
A Perpendicular line is a line through a point and perpendicular to another line. Create the perpendicular line by clicking on a line and a point.
-
A Parallel line is a line through a point and parallel to another line. Create the parallel line by clicking on a line and a point.
-
An Angle bisector is a line that divides an angle into two equal angles. You create the angle bisector by selecting the three points that define an angle.
For example, to define the angle bisector for an angle , you select the points , , and .Figure: Creating an angle bisector.
-
A Perpendicular bisector of two points is the line at an equal distance to these points. Create the perpendicular bisector by selecting the two points.
The live example below shows the construction elements in a triangle. Use the dropdown to select the demo.
Live example of construction elements in a triangle. Drag the triangle points to see how the construction elements move accordingly.
Transformation elements
Transformations create image points of existing points. To create a transformation, you first click the point of which you want to make the image point. Next, you click the element that defines the transformation. Based on the type of transformation, this can be a point, line, or vector.
- Reflection with respect to a line. Click the point first and then the reflection line.
- Reflection with respect to a point. Click the point first and then the reflection point.
- Translation is defined by a vector, so add a vector element to the canvas first. To create the translation, click the point first, then the vector.
- Dilation. First click the point, then the point that will act as the origin of the dilation. An input dialog appears for the dilation factor. You can later change the dilation factor in the element panel.
- Rotation. First click the point, then the point that will act as the origin of the rotation. An input dialog appears for the rotation angle. You can later change the rotation angle in the element panel.
The live example below shows all transformation elements. Use the dropdown to select the transformation demo.
Live example of transformation elements. You can drag the points of the triangle and the red elements.
Angle elements
The Geometry & Graphs question type offers two tools for angles. One to indicate existing angles and one to create fixed angles of a given size.
Live example with two angle indicators and one angle fixed to 60 degrees. Drag points , and to see these tools in action.
Angle indicators mark angles with a small circle segment. You can configure in the element panel whether the angle label or the angle size should be visible. You create the angle indicator by clicking three points that define the angle.
You can create a fixed angle by clicking on two points that define one leg of the angle and entering the angle size in the dialogue box. A new point will be added to the canvas such that the three points mark the desired angle.

Graph element
The Graph tool allows you to draw smooth graphs through a set of points.

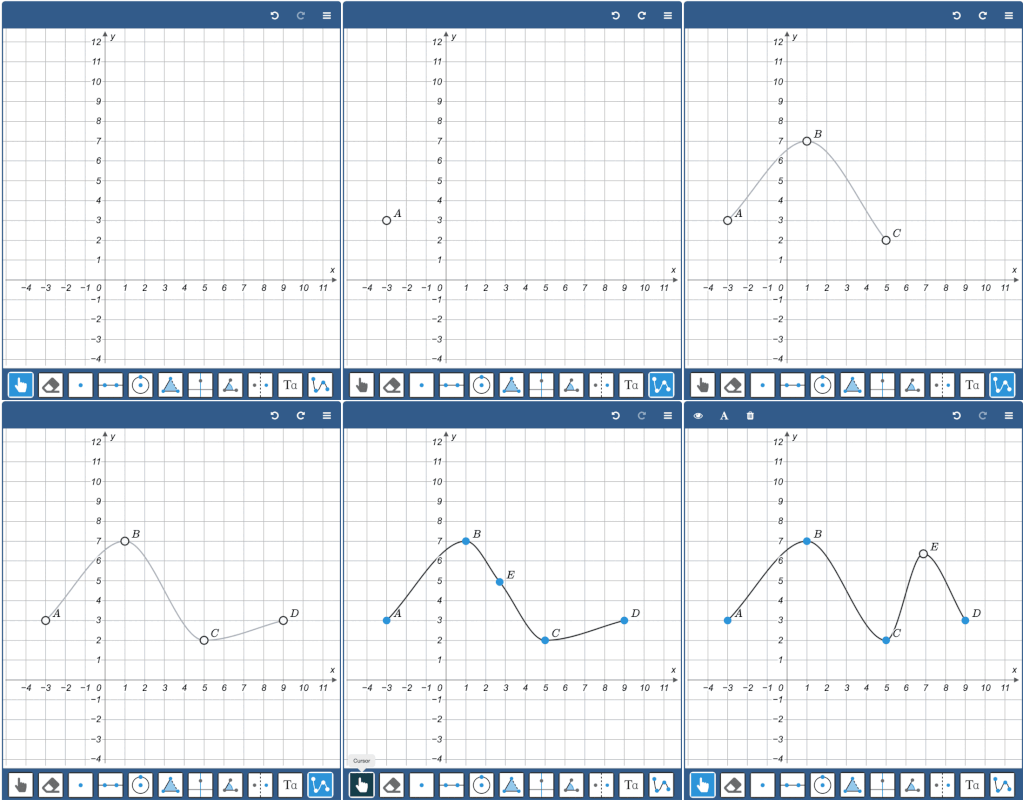
To create the graph, enable the Graph tool and click on the canvas to create the consecutive points. Finalize the graph by clicking outside the canvas or pressing enter or escape.
You can drag the points after the graph is created. You can also add new points to an existing graph by selecting the graph first and then adding the new points.
You can remove existing points from a graph by clicking the point again.
Live example: Use the Graph tool to create a graph. The second example shows a graph with points that are constrained to a line segment.
Graph Edge element
You can use Geometry & Graphs to create graphs of vertices and edges instead of a function graph. Use the Edge Tool to connect points (vertices).
- Click a point twice to create a loop
- Select a line and drag the center point to bend the edge
- Select a line and use the toolbar above the canvas to configure the label or hatch mark.
Live example: A graph with vertices and edges.
Text element
Using the Text Tool, you can add text or math expressions to the canvas. Click in the canvas and enter the formula in the dialog.
The text element can be anchored to an existing point to make it move with that point. You can select the anchor point by clicking on that point when you create the expression or by entering the point ID in the properties in the element panel.
Note that you can also use point labels to add math content. Use the Text Tool for more flexibility regarding where to position the content.
